Use Explorer
The Explorer provides a comprehensive view of your organization's application layer to better understand your security posture. It helps you compare risks across applications and all their related entities.
SOC Analysts can use the Explorer to better understand their organization's attack surface and risks.
AppSec teams can use the Explorer to understand the applications they manage and their associated risk, prioritize remediation, and configure policy for the applications in scope.
Developers can use the Explorer to understand the applications they manage and the risk tied to them, in the same view AppSec teams do, so both sides are working from the same picture.
Entities in Explorer are applications, servers, called APIs, databases or datastores and open-source libraries. Explorer also surfaces AI usage as an attribute on application entities when Contrast agents detect calls to AI and machine learning libraries or external AI services.
Explorer application actions
From the details panels for application entities, you can:
Explore incidents and issues related to the selected applications.
Configure policies for Assess rules, ADR (Protect) rules, and exclusions.
Before you begin
The entities that you see in Explorer depend on the permissions you have to view specific resources, as defined in your access control settings.
View Explorer entities
In the left navigation, select Explorer > Contrast Graph.
The initial display shows a visual representation of the complete application layer for an environment in your organization.
Application entities display the Contrast score to help you quickly see which areas in your application are most at risk. See Contrast score for more information.

Use your mouse, trackpad, or other navigation device to zoom in on or move the view.
Select Prod, QA, or Dev to focus the view on entities in that environment. Explorer defaults to the highest-priority environment that has Contrast data. For example, if applications are running in production, defaults to Prod. If there is no production data, Explorer defaults to QA or Dev, depending on which has data.
Select Include static-only to include entities Contrast has only observed through static analysis, without runtime data.
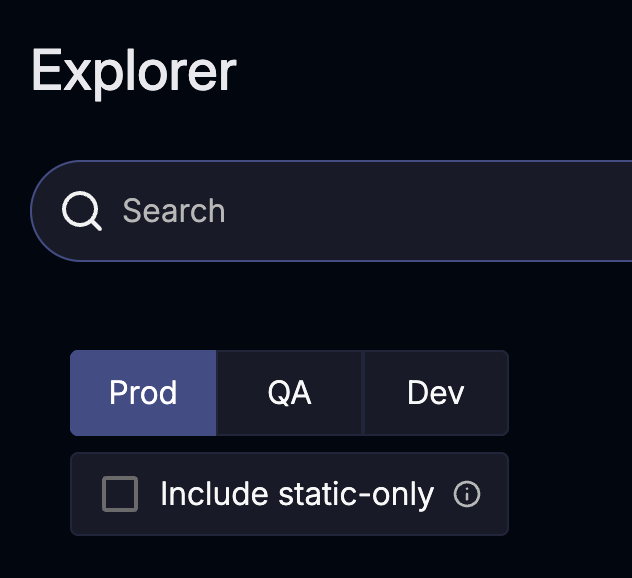
To focus the view on a specific entity and its connections, enter a full or partial entity name in the search bar. You can also enter the full or partial name for a CVE.
The search results include the searched-for entity and any entities connected to it. The results also reflect filter settings.
Select an Application entity to open the Application details page that contains the following tabs:
Overview: Contrast score, a Profile panel (language, routing framework, last seen), Criticality, Routes exercised, incidents, and issues by severity. Provides fast context for Developers, AppSec teams, and SOC Analysts arriving from an incident.
Libraries summary: Library issues by severity, CVE by status, and a CVE Shield exposure trend chart for the application's libraries. Provides remediation triage for AppSec teams and Developers.
Library details: A sortable, paginated table of every library, version, and CVE affecting the application, with per-environment issue status. Provides tracking remediation across environments for developers and AppSec.
Policy: Assess rules, Protect rules, and Exclusions rule tables you can manage, with per-environment mode toggles. Useful for AppSec and SOC Analysts for referencing ADR settings during an investigation.
Entity
Details
Servers
Hovering over a server node shows the Type of server associated with one or more applications and the Agent language used for associated applications.
Called API
Domain: The domain name for an API.
Database
Server address: The address for the server.
System: The type of database, for example, MySQL.
Server port: The number of the port the database is using to communicate with the server.
Libraries
Library entities represent either a root open-source library or a transitive dependency.
Root library entities show the number of dependencies. You can expand these entities to view all dependencies or just the next level of entities in the dependency chain.

The details panel for root library entities shows:
CVEs tab
CVE: CVE numbers linked to the NIST CVE description.
Score: The Contrast score
Library: The name of the affected library
Path: The path in the application to the library.
Dependencies tab: The Dependencies tab shows the dependency tree for the root library. Select the SBOM button to generate a CycloneDX version of the report. It includes the component name and version, origin or source (open-source or proprietary), license information, supply chain relationships (dependencies), and vulnerabilities.
Entities for transitive dependencies show the name of the library. In some cases, you can expand these entities to view another level of dependencies.

The details panel for a transitive dependency entity can include:
Name: The name of the library.
Version: The library version.
Language: The library language.
Licenses: The name of the license that applies to the library. For example, Apache-2.0.
Released: The date the library was released.
Ancestors (if applicable): The libraries that uses the transitive dependency indirectly.
For example, If Library 1 calls Library 2, Library 1 is the ancestor of Library 2.
Issues (if applicable): A link to the issues that Contrast created.
Selecting a link opens the Issues view.
Direct CVEs (if applicable): CVEs that indicates a software flaw exists that lets an attacker take direct action, unauthorized access, or control of software.
Descendant CVEs (if applicable):
A descendant CVE is a vulnerability in a child process (descendant) of another process.
CVE link: A link to the NIST description of the CVE
Library: The name of the transitive dependency
Path: The path to the affected dependencies
Score: The CVSS (Common Vulnerability Scoring System) score
Refine the Explorer view
To refine the view, select the Filter icon ( ) to open the filter panel and select one or more filters and filter options. The available filters are:
Type: Type of entity: application, server, API, database, or library
Language: Languages for the applications you want to view
Open issue severity: Issue severity
Open incident severity: Incident severity
Application: Application name. Selecting a parent application name also selects its child applications. You can remove the parent or any child from the selection.
Repositories: Filter by connected source code repository. This is a searchable, multi-select list.
AI: Whether the application uses AI/ML functionality, as detected by the agents. Select Uses AI to show only applications with detected AI/ML activity. Select Does not use AI to show only applications where no AI/ML activity has been detected.
Lifecycle: Filter applications by whether they are Active or Archived. Defaults to Active only, so archived applications don’t clutter the graph unless you ask for them.
Repository status: Filter repositories by whether they are Active or Archived. Defaults to Active only, so archived repositories don’t clutter the graph unless you ask for them. Select both options to show repositories in either state.
Archived repositories appear with a dashed outline, the same as archived applications. Select an archived repository to open its details, where you can restore it. See Manage repositories for details.
Tip
Filter selections are saved in the page address, so you can bookmark or share a filtered view.
Where to go next
Once you've tuned the view, how you use Explorer depends on what you're trying to accomplish.
For Developers and AppSec teams working from one or a few applications:
Filter to Application and search for the applications you own, rather than browsing the full graph.
Select an application to open its details page. Start with the Overview tab for a general read on Criticality, Issues, and Incidents, then move to Libraries summary or Library details depending on whether you're scanning for risk or already remediating something specific.
Use the Open issue severity and Open incident severity filters to cut straight to what needs attention, rather than reading every entity.
SOC Analysts working across the organization:
Zoom out first. The goal is attack surface at a glance, not one application's detail.
Turn off Include static-only to see runtime activity only, since that's where attacks actually happen, then filter by Open incident severity to surface active threats first.
Watch for CVE Shield status badges on library cluster nodes across the graph, not just within one application. They're the fastest visual signal for where exposure exists at scale.
Use Lifecycle and Repository status to exclude archived applications and repositories from a broad scan, so retired entities don’t dilute the picture.
The Contrast score represents the risk of an issue or incident at a particular point in time. Contrast calculates this score using information from Contrast SAST, IAST, SCA, ADR, and Observability technologies. For issues with an active CVE Shield, the score also adjusts automatically as shield status changes. It drops while the shield protects the vulnerability and rises again if the shielded vulnerability comes under attack.