View insights for runtime behavior
Before you begin
Verify that the observe mode setting is turned on in the agent's configuration file.
Steps
Select Applications from the header
Select an application.
Select Behavior.

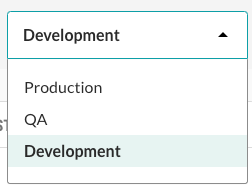
To view details for a specific application environment, select it in the dropdown above the list.

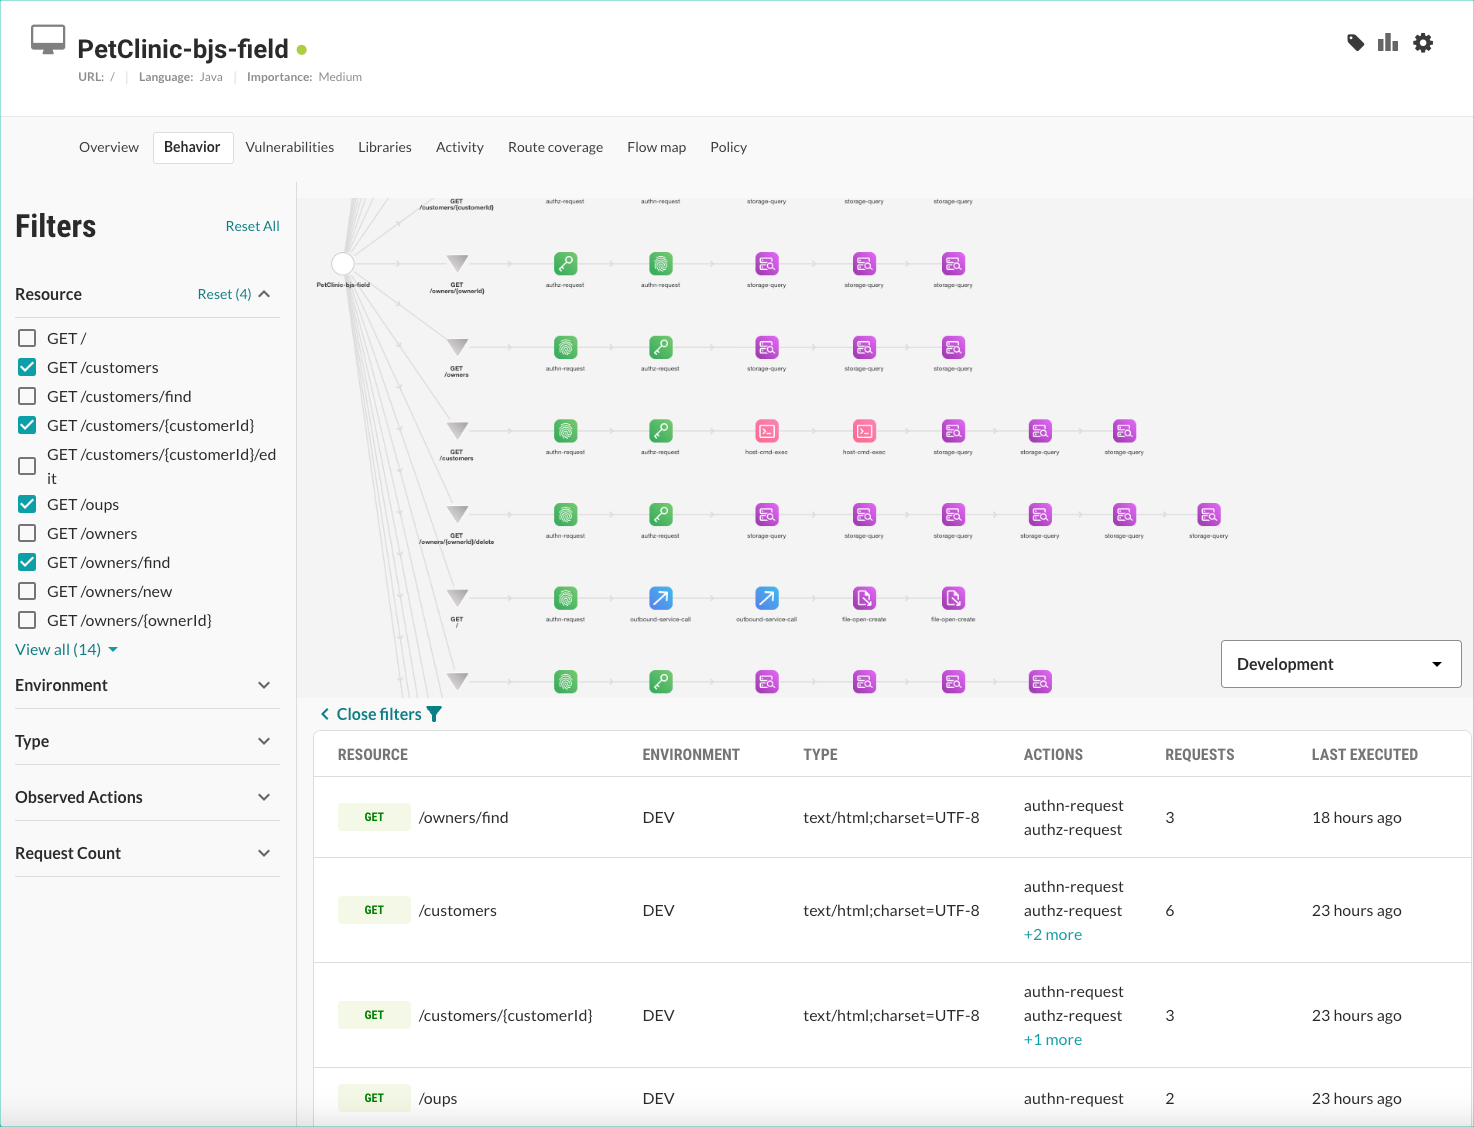
To refine the view with filters:
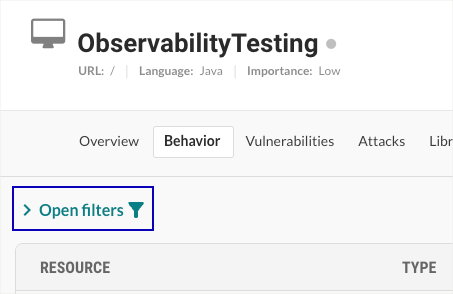
Select Open filters

Select all the filters you want to use. The filters are:
Resource: Select one or more resources.
Environment: Select any or all of these environments: Development, Production, and QA
Type: Select any or all data exchange types.
Observed actions: Select the actions you want to view from these categories. For example, Authn-Request, File-Open-Create, and Storage-Query.
Request count: Select a count grouping, from 0-1000 up to 100000+.

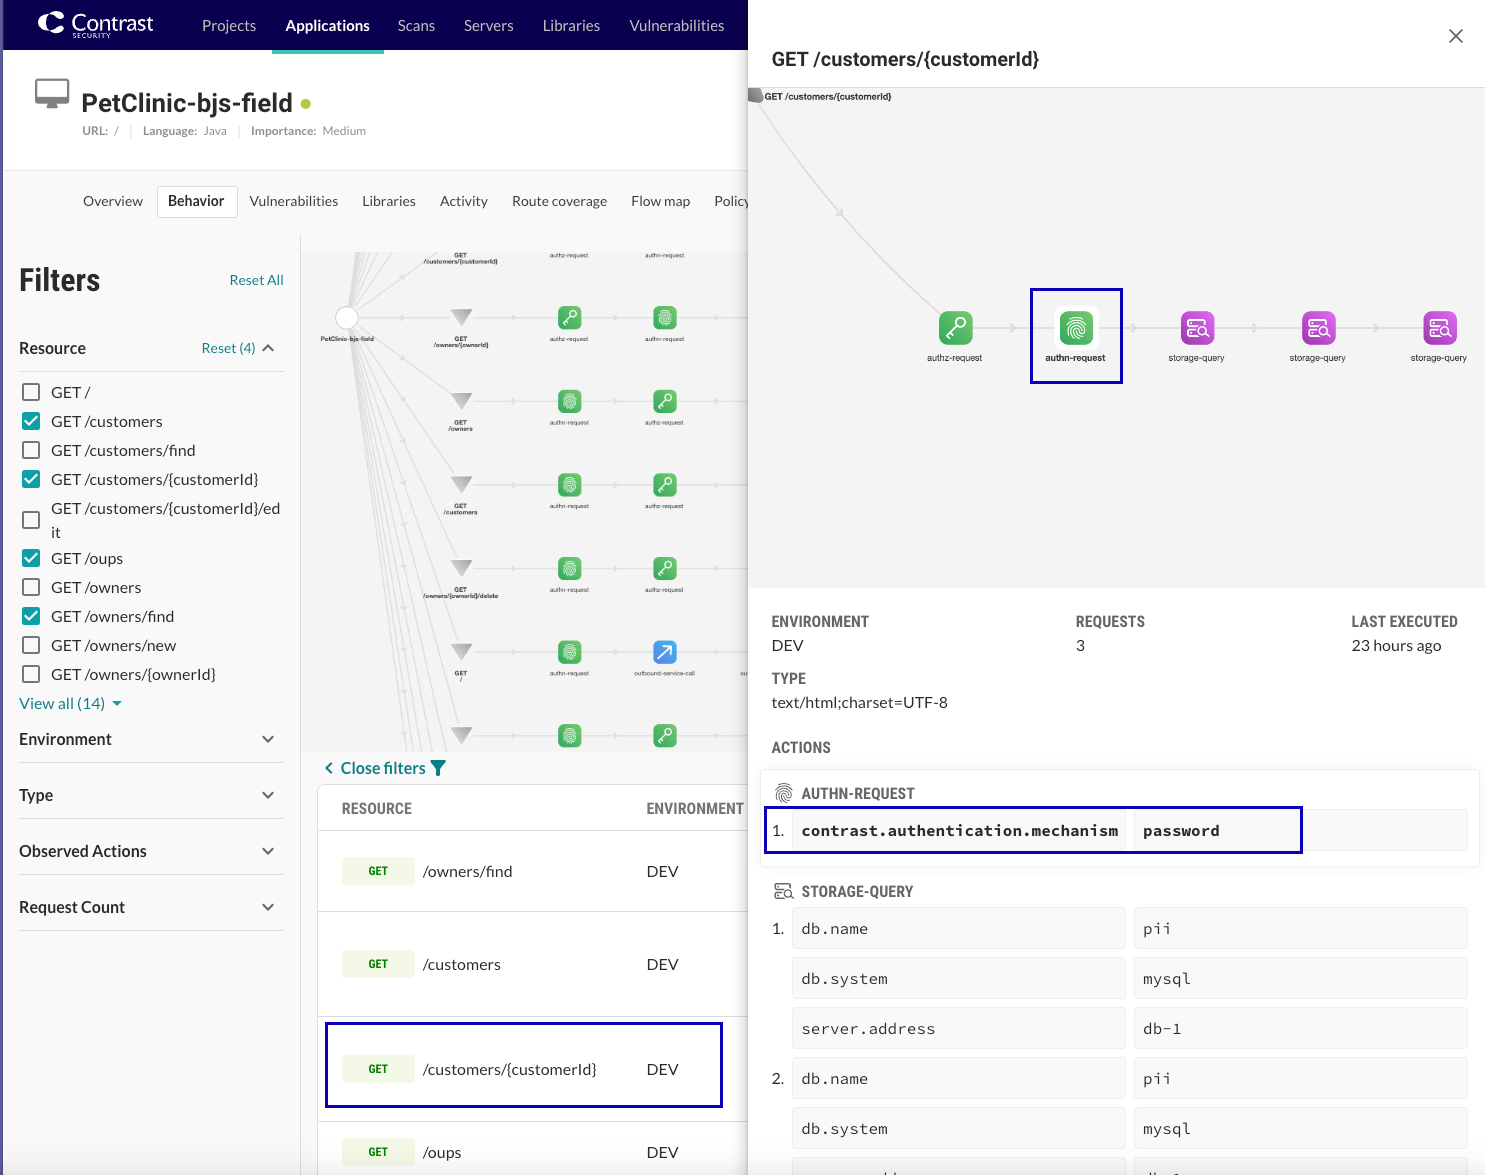
To view additional details, select a resource in the list.
This selection opens a panel that shows a model of the resource behavior and connections to other components that Contrast detects. It also shows details for the actions, including database queries and outgoing API calls
When you select an element in the model, the list highlights the actions associated with that element.
