Vulnerability trend reports
Use the vulnerability trend reports to recognize the vulnerabilities your applications face and how well they're being managed.
To view vulnerability trend reports:
Select Reports in the user menu. Select View to see the graphs in more detail.
Select New to see a graph of new vulnerabilities. Select Total to see a graph of all reported vulnerabilities compared to all remediated vulnerabilities.
Each black data point represents the total number of Suspicious, Confirmed and Reported vulnerabilities for that date. Each green data point represents the total number of vulnerabilities marked as Not a problem, Remediated or Fixed. Hovering over each data point generates a tooltip with status breakdowns.
Each report defaults to all applications, servers and rules. Filter vulnerabilities by clicking in the fields above the graph. The following table outlines the categories that you can use to create a custom report.
Field
Default
Filter options
Date
Last 7 days
Last 30 days
Last 12 weeks
Last 12 months
Applications
All
Importance (Critical, High, Medium, Low, Unimportant)
Application Tags
Licensed (List of all applications)
Servers
All
Environment (development, test, production)
Server Tags
Servers (List of all servers)
Rules
All
Severity (Critical, High, Medium, Low, Note)
Vulnerability Tags
Vulnerability Rules (List of all rules)
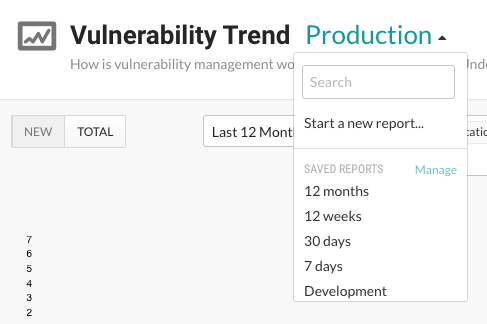
Select View, then select the Save report icon in the top right to save this filter criteria to a report. Name the report in the window that appears and select Save. Saved reports are unique to the user, so you have your own defined list of saved vulnerability trend reports. You can edit or delete these reports at any time.
If you change filter options while viewing a saved report, the star icon changes to an unsaved state and Edited appears next to the report name. You can then use the same icon to Save existing or Save as new. Choose Save existing to update the saved report name with the current filters and remove the Edited status. Choose Save as new to save the report view with the current filters as a new report under a different name.
Click Remove to permanently delete the saved report that you're currently viewing.
To clear unsaved edits to an existing report and start over with the report defaults, choose the Start a new report option in the dropdown.
When you've created more than five saved reports, you will see a Manage link in the Saved reports dropdown. Select Manage to open this window. Here you can rename reports (click on the name to edit), search for reports, or use the check boxes next to each report (or use the Select all check box) to select which ones you want to remove.

You can also create a timestamped PDF export of the Vulnerability Trend to capture a snapshot of your vulnerability management. Select the Export icon in the upper right hand corner of the page. Contrast downloads the report to your desktop. Each PDF report includes a summary of the variables included in your customized view, the trend graphic, and a table of the metrics and breakdowns of each data point.