View function and service relationships
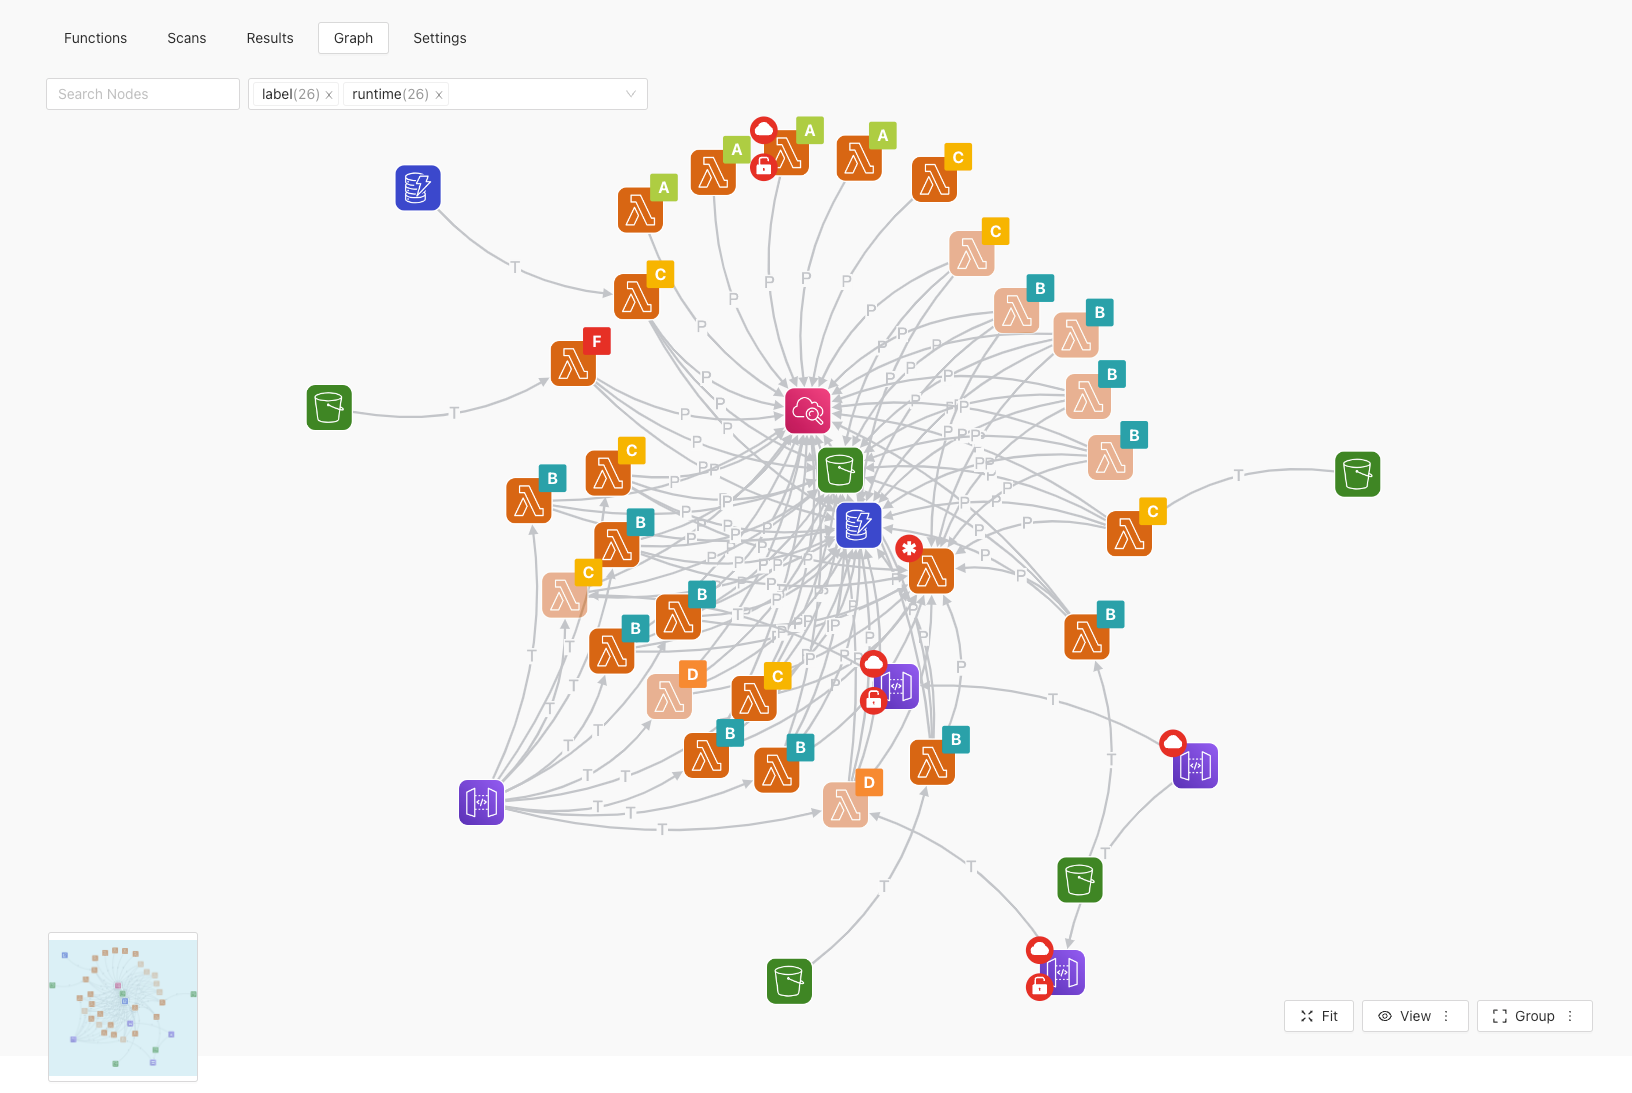
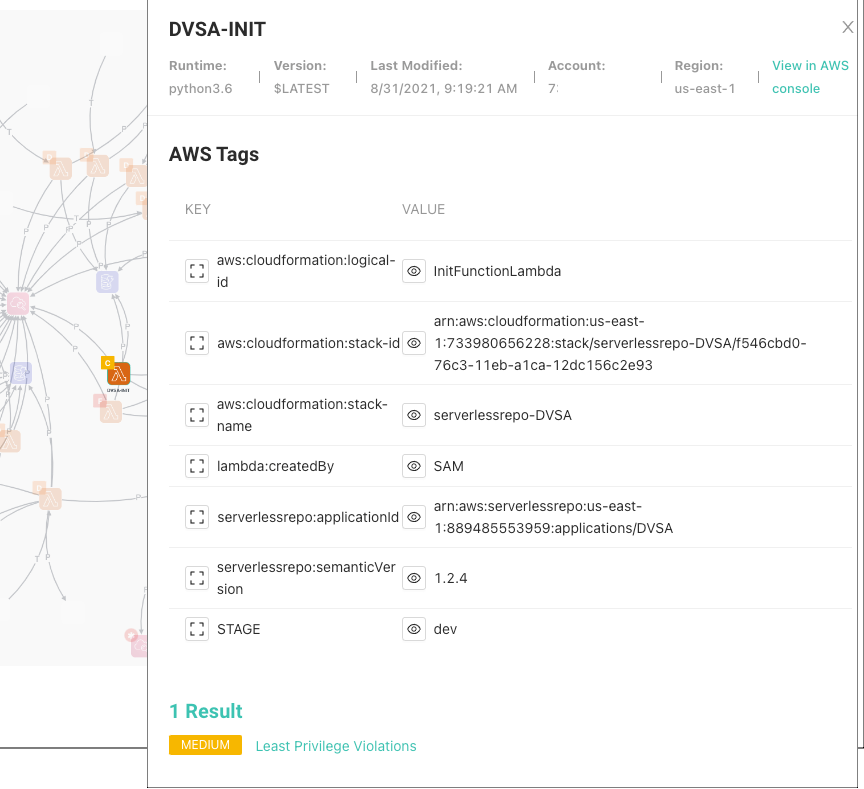
The Graph tab displays a diagram that shows the relationship between functions and services. You can also view details about each element in the diagram, including:
Tags
Vulnerability results
Permissions
Security posture score: The security posture score is based on the function's trigger configuration. Internet-accessible triggers and misconfigurations, such as open buckets and unauthenticated APIs, receive lower scores.
Unused functions (shadow functions) from dynamic instrumented analysis
Warning
There is a limit to the results available in this graph. See Graph limits for more information.

Select Serverless in the header.
Select the Graph tab.
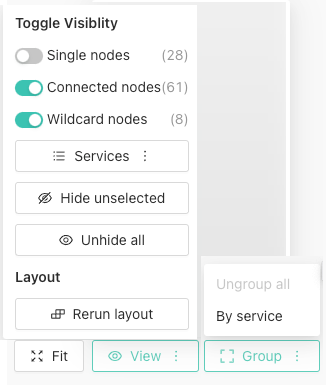
To adjust the view, use the options at the bottom of the graph.

Fit: This allows you to resize the graph to fit your display
View: This allows you to filter the view by nodes and services. You can also hide or unhide nodes.
Group: You can group services together
Select the element to view details about individual elements.
Contrast displays a details window for the selected element. Select the tags to filter the view.
