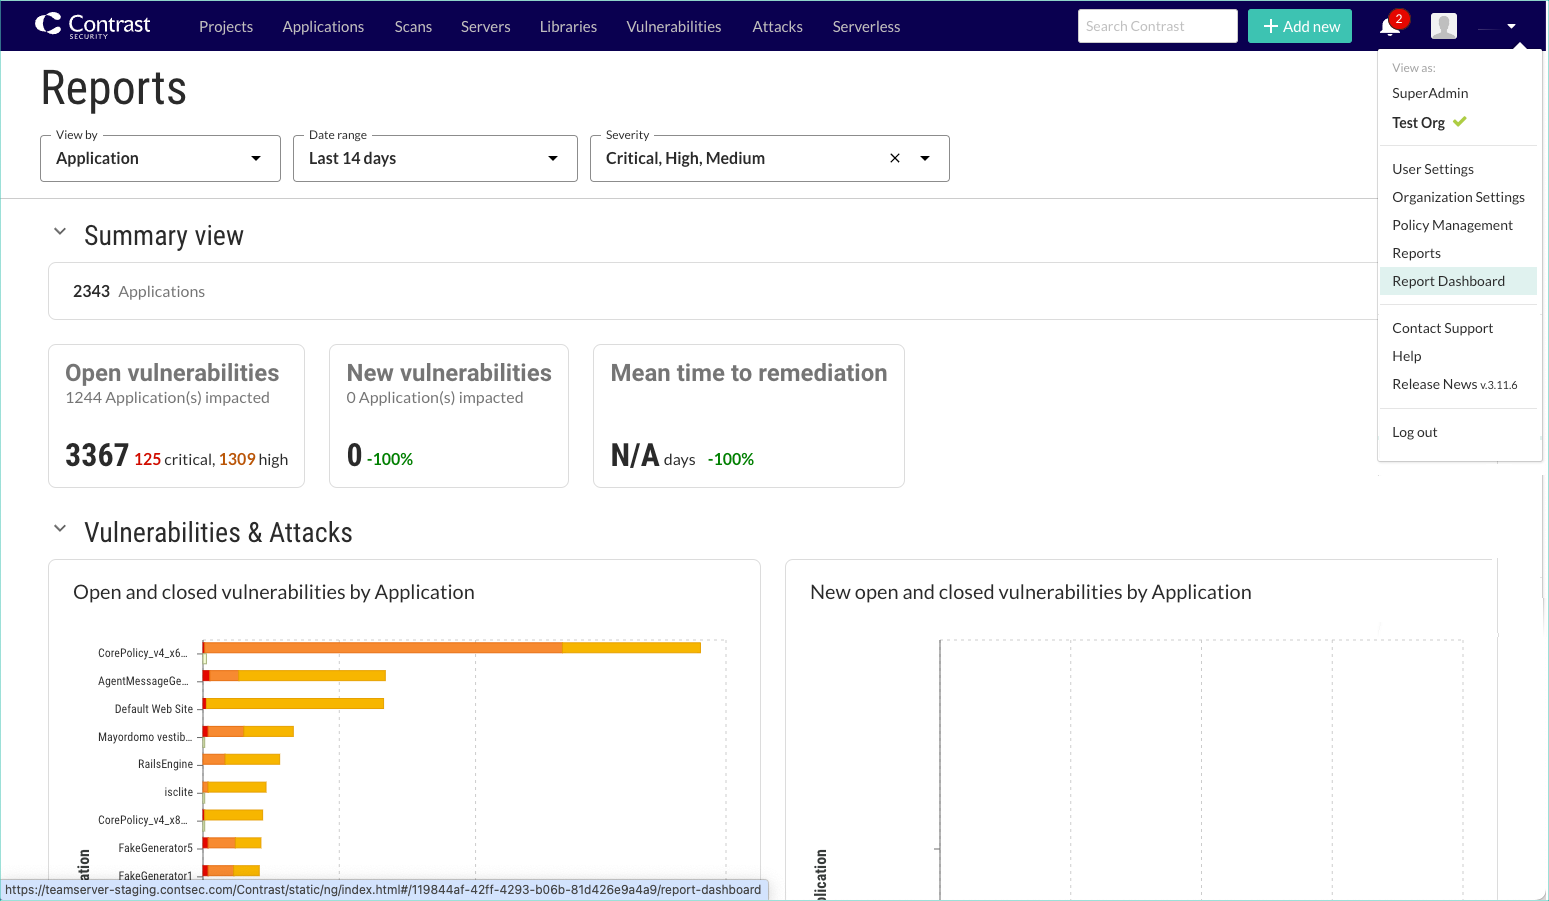
Report dashboard (Preview)
The report dashboard lets you view aggregated statistics for vulnerabilities in your organization. It also provides details that help you understand your organization's progress with managing and fixing vulnerabilities.
If you are using role-based access control, the report shows details based on the resources associated with your role.

Report dashboard details
Summary view
If you select Application in the View by filter, the summary shows the total number of applications included in this report. If you select application metadata, the summary also shows the number of values found for the selected metatdata. .
Open vulnerabilities: The number of vulnerabilities that have no closed date or have a closed date that occurred after the selected time frame.
New vulnerabilities: The number of vulnerabilities that Contrast first detected during the selected time frame.
Mean time to remediation: The average time it took to close a security vulnerability during the selected time frame.
Vulnerabilities and attacks
To see additional details, hover over the bars in each chart.
Open and closed vulnerabilities: All open and closed vulnerabilities as of the current date.
New open and closed vulnerabilities: Vulnerabilities that were opened or closed during the selected time frame. vulnerabilities
Top vulnerability types to fix: The vulnerabilities that Contrast considers the most important ones to fix.
Open and closed rates: Trends that show the rate at which teams close open vulnerabilities
Application or metadata group
This section shows details for all applications or the applications that use the selected metadata. To view additional details, hover over the bars in the chart.
Name or Value: The application name or the value for selected metadata.
Onboarded apps: The number of applications added to Contrast or the number of applications in Contrast that use the selected metadata.
Open vulns: The number of vulnerabilities with an open status in the specified time frame
New vulns: The number of vulnerabilities that Contrast reported in the specified time frame
Closed: The number of vulnerabilities that closed in the specified time frame.
Mean time to remediation: The average time it took to fix the vulnerabilities in the specified time frame.