Performance expectations for the Java agent with Protect
To provide insights into its impact on performance, we have gathered information based on internal tests conducted with a sample Java application. Please note that the actual performance numbers may vary based on several other factors.
CPU Usage
The Java agent typically utilizes 5-15% of CPU resources
This range provides an estimate of the additional CPU load incurred when the agent is enabled in Protect mode
The impact may vary based on the complexity of your application, the load it experiences, and other environmental factors
Memory consumption
The Java agent typically requires 200-300 MB of additional memory
This memory usage accounts for the Agent's operations and any associated data structures
The actual memory impact may depend on the size and complexity of your application, as well as the number of concurrent requests it handles
Latency
Enabling the Java agent in Protect mode may introduce additional latency to the processing of requests
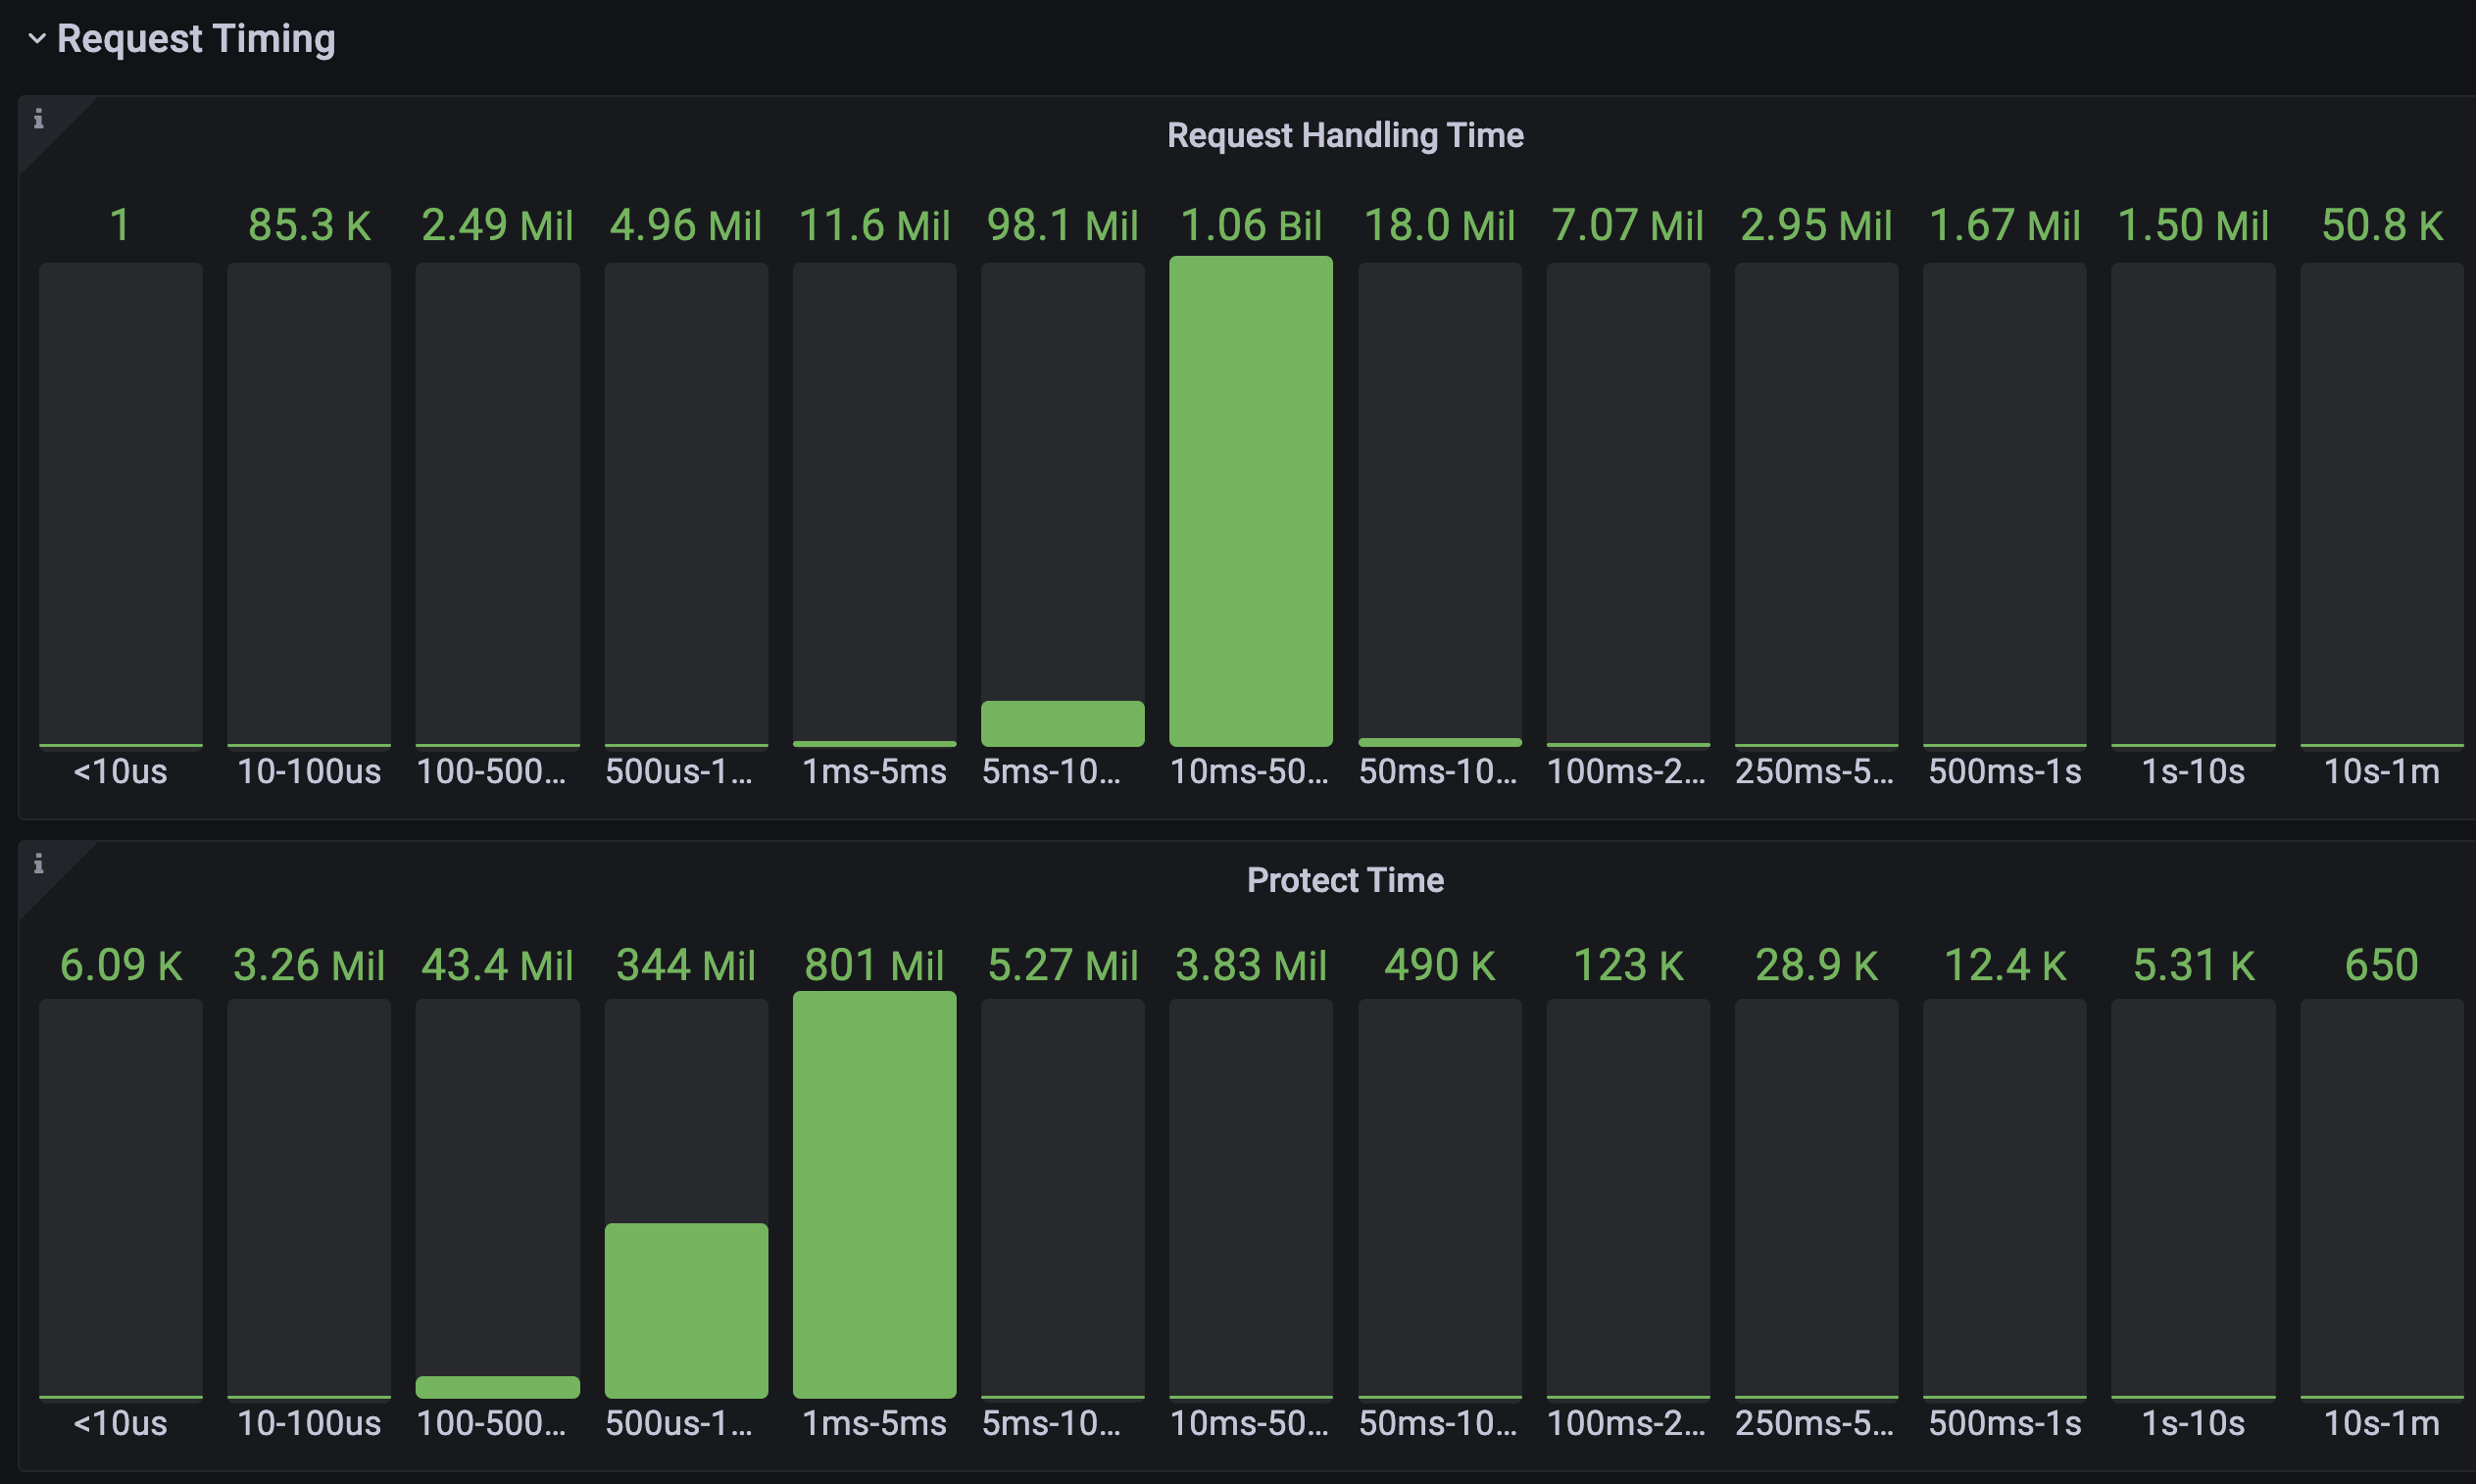
99% of observed requests for Protect analysis take between 100 µs - 5 ms
The specific impact will depend on various factors like the application's workload, the number of concurrent users, and the nature of the requests
It is important to note that the latency introduced is generally minimal, but it may vary based on your specific application characteristics. These performance numbers serve as a baseline to provide you with an initial understanding of the Java agent's impact on your application. However, we emphasize that the actual performance impact may differ based on the unique aspects of your environment and application. We recommend conducting your performance tests using representative workloads and realistic scenarios to accurately gauge the impact on your application's performance. By simulating conditions similar to your production environment, you can fine-tune the configuration and evaluate the trade-off between security and performance. Our team is committed to continuously enhancing the Java agent's efficiency and optimizing its impact on your application's performance. We value your feedback and encourage you to reach out to us with any performance-related observations or concerns. Feel free to contact our support team if you require any assistance or further information regarding the performance characteristics of our Java agent. We are here to help you ensure the security and stability of your application while maintaining optimal performance levels.
The following graph illustrates a combined representation of the request handling time for real customer host applications instrumented with our agent. It showcases a 24-hour sample of Java performance impact.

The top row shows the overall request handling time, indicating that a substantial portion of the HTTP requests, approximately 93% of requests (1.06 billion hits), fall within the 10 millisecond to 50 milliseconds range. Additionally, you can see 98.1 million hits with a handling time between 5 and 10 milliseconds, while the remaining handling times follow a normal distribution.
The bottom row displays the Protect time, which represents the length of time our Protect RASP product takes to analyze each request. Notably, among the total requests, 800 million were analyzed within a time frame of 1 to 5 milliseconds, demonstrating a negligible impact on latency. Similarly, an additional 344 million requests underwent analysis within an even shorter time range of 0.5 to 1 milliseconds, indicating minimal latency impact. The distribution of request handling times for host applications instrumented with our agent allows us to observe the number of requests falling into different time ranges while also providing insights on the performance impact introduced by Protect.
Garbage collecting and other JVM elements can pause execution, which impacts timing.