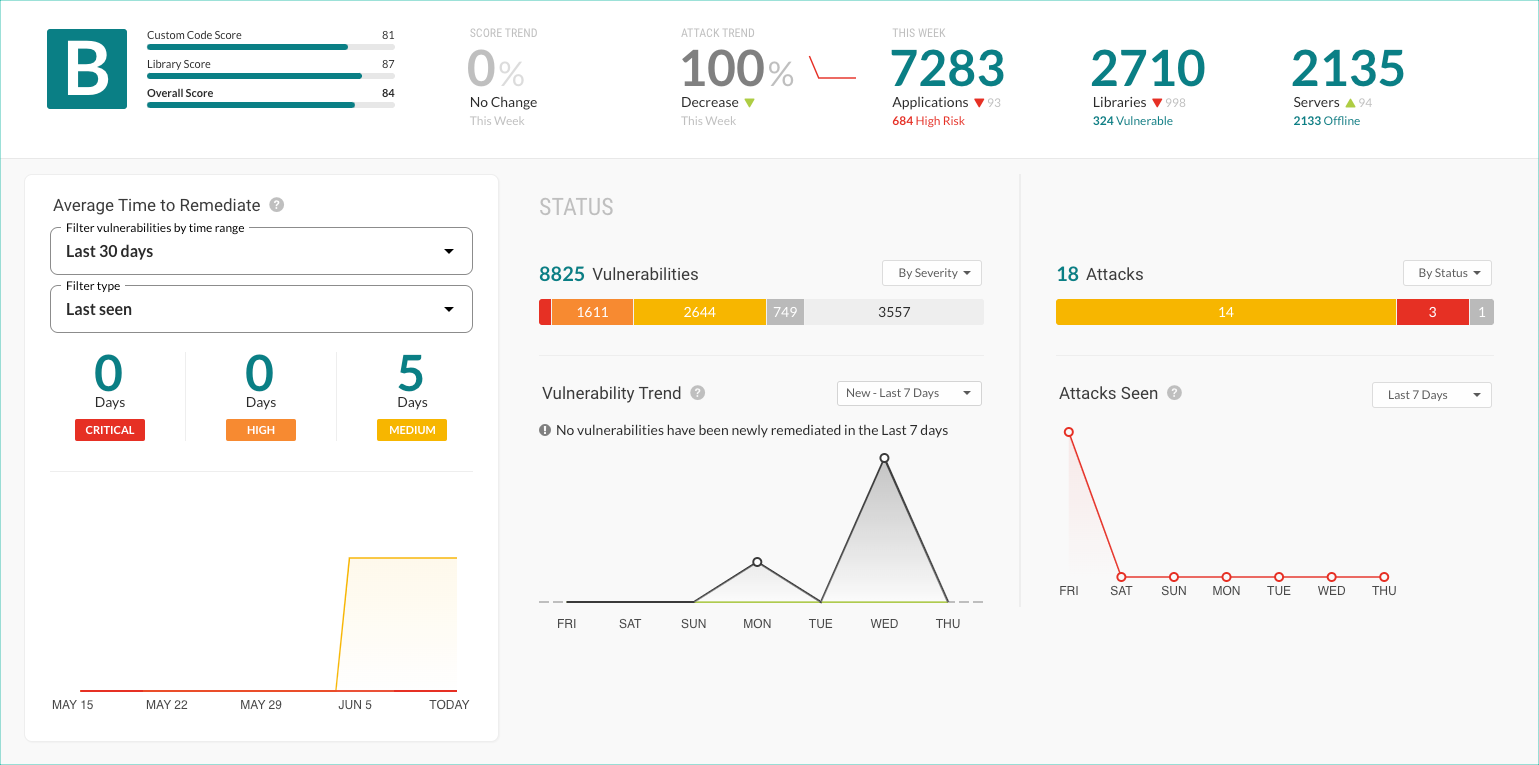
Contrast dashboard
Typically, when you log in to Contrast, you see the Contrast dashboard. The dashboard provides a high-level view of the state of your application risks to vulnerabilities and attack threats. It also provides trend information for vulnerability remediation and attacks.

Dashboard details
Summary: The summary at the top of the dashboard provides these details
Application Score: This section shows the Custom Code score, the Library score, and the Overall score. The Application scoring guide describes how Contrast calculates these scores.
Score trend: This value shows whether your application score is improving.
Attack trend: This value shows whether your level of risk due to attacks is improving.
This week's status for applications: This value shows the number of deployed applications and the number of applications at risk for vulnerabilities for the current week.
Library status: This value shows the number of libraries discovered and the number of libraries at risk for vulnerabilities.
Server status: This value shows the number of known servers and their status.
Average time to remediate: This section shows the current Average Time to Remediate (ATTR) vulnerabilities with a critical, high, and medium severity. It also shows the ATTR for critical, high, and medium vulnerabilities over time in a graph.
Use the filters to select a specific time frame and data type to refine the displayed details. The data types are: Last seen, First seen, and Closed.
When you use these filters, the graph and counts update based on the following criteria:
Vulnerabilities in a closed state.
Vulnerabilities with a last seen date within the date range.
The average time to remediation (ATTR) from the set of vulnerabilities. Contrast calculates this value by looking at the difference between the first seen and closed dates on the selected vulnerabilities, and averaging them.
Status and trends for vulnerabilities: This section shows the number and types of vulnerabilities that Contrast discovered and are not remediated. It also shows the remediate trend.
For the vulnerability status, use the filter to refine the view by severity, status, or type.
For the vulnerability trend, use the filter to set a time frame for the trend details.
Attack status and trends: This section shows the number of attacks and the trend for attacks that Contrast has seen.
For the attack status, use the filter to refine the view by status or type.
For the attack trend, use the filter to select a specific time frame for the trend details.